Why Competitive Analysis Matters More Than Ever in 2026
To analyze any competitor's Instagram Reels in 10 minutes in 2026: install the free IShort Chrome extension, visit their /reels/ page, scroll to load their Reels, then open IShort to see views, engagement rate, posting times, top hashtags, and audio choices — all without logging in, switching accounts, or paying for a SaaS tool. Below: the exact 5-step method, plus what to look for in their data.
Competitive analysis is the foundation of that strategy. Without it, you are guessing. You are posting content based on what you think will work, rather than what the data shows actually works. You are experimenting blindly when you could be learning from the experiments your competitors have already run for you.
Think about it this way: every competitor in your niche has published dozens or hundreds of Reels. Each one is a data point. Some went viral, some flopped, and most landed somewhere in between. The patterns hidden in that data tell you exactly what your shared audience responds to. The content themes they care about. The video lengths they prefer. The posting times when they are most active. The hashtags that expand reach versus the ones that do nothing.
The problem has always been access to that data. Instagram does not provide any tools to analyze competitor accounts. You cannot see their engagement rates, sort their content by views, or export their posting history. You would have to manually click through every single Reel, note down the metrics, and build a spreadsheet from scratch. For a competitor with 200 Reels, that could take an entire day.
That is why tools like IShort's competitor analysis feature exist. IShort works on any public Instagram profile, not just your own. Visit a competitor's Reels tab, scroll through their content, and the extension automatically collects every data point you need. Views, likes, comments, engagement rates, posting dates, video duration, audio type, hashtags, mentions, and more. What would take hours manually takes minutes with IShort.
The competitive advantage: Creators who regularly analyze their competitors grow 2-3x faster because they eliminate guesswork and focus their energy on proven content strategies. Competitive analysis is not optional in 2026. It is the difference between growth and stagnation.
The Six Pillars of Competitor Reels Analysis
A thorough competitive analysis covers six distinct areas. Each one reveals different insights about what drives success in your niche. Neglecting any one of them leaves a gap in your understanding.
Content Themes
What topics and formats generate the most views and engagement? Identify recurring themes in their top-performing Reels to understand what your shared audience cares about most.
Posting Frequency
How often do they post, and does consistency correlate with better performance? Track their posting cadence to find the sweet spot between quality and quantity in your niche.
Engagement Patterns
Which Reels drive disproportionate likes and comments relative to views? High engagement rate signals content that truly resonates, not just content that got algorithmic push.
Audio Choices
Do they use original audio, trending sounds, or licensed music? Audio choice significantly impacts algorithmic distribution and audience connection. Track what works for them.
Hashtag Usage
Which hashtags appear in their highest-performing Reels? How many do they use? Are they niche-specific or broad? Hashtag strategy varies dramatically by niche.
Video Length
What is the average duration of their top Reels versus their worst? Video length preferences differ by niche and audience. Data reveals the optimal range for your space.
Pillar 1: Content Themes and Topics
Content themes are the most important factor in competitive analysis. The topic of a Reel determines whether your audience cares enough to stop scrolling and watch. Use IShort to sort a competitor's Reels by views, then study the top 20 percent. What patterns do you see?
Look for these specific signals:
- Recurring topics - Do certain subjects appear repeatedly in their top Reels? If a fitness creator's top 10 Reels are all about meal prep, that tells you meal prep content outperforms workout content for their audience.
- Content format - Are their best Reels talking-head style, text overlay tutorials, before/after transformations, or storytelling narratives? Format often matters as much as topic.
- Hook patterns - Watch the first 3 seconds of their top Reels. What hooks do they use? Questions, bold claims, surprising visuals, or curiosity gaps? The hook determines whether people watch or scroll.
- Call-to-action style - How do they end their Reels? Do they ask for comments, direct to their bio link, or simply end with a statement? CTA style affects engagement metrics directly.
Document these patterns in a spreadsheet. After analyzing 3-5 competitors, you will see clear trends that define what works in your niche. These are the content pillars you should build your strategy around.
Pillar 2: Posting Frequency and Consistency
Posting frequency is one of the most debated topics in content creation. Some gurus say post daily. Others say quality over quantity. The truth is niche-specific, and competitive analysis reveals the answer for your space.
Export a competitor's data using IShort and calculate:
- Average posts per week - Count total Reels over a date range and divide. This is their baseline frequency.
- Frequency vs. performance correlation - Do weeks with more posts show higher or lower average views per Reel? Some accounts see diminishing returns when they post too frequently.
- Posting gaps - Are there periods where they stopped posting? Did their performance drop or recover when they resumed? This tells you how forgiving the algorithm is in your niche.
- Day-of-week distribution - Do they post every day or concentrate on specific days? IShort's posting times heatmap shows this visually.
Pillar 3: Engagement Patterns
Views tell you about reach. Engagement tells you about resonance. A Reel with 100K views and 0.5% engagement rate is fundamentally different from one with 50K views and 5% engagement rate. The second one created a real connection with viewers.
Sort competitor Reels by engagement rate (not views) to find the content that truly resonated. Often, the highest-engagement Reels are not the highest-view ones. They might be personal stories, controversial takes, or niche-specific tutorials that a smaller but more invested audience loved.
These high-engagement, moderate-view Reels are often the best content to model. They represent topics and formats where the audience feels compelled to interact, not just watch passively. That interaction signals quality to the algorithm, which can lead to sustained growth over time.
Pillar 4: Audio Strategy
Audio choice is a major factor in Reels performance, and it varies wildly by niche. In some niches, trending sounds are essential. In others, original audio performs significantly better because authenticity and expertise are valued more than entertainment.
IShort tracks audio type for every Reel. When analyzing a competitor, look at:
- Original audio vs. licensed music ratio - What percentage of their Reels use original audio versus trending sounds?
- Performance by audio type - Do their original audio Reels get more or fewer views on average? What about engagement rate?
- Trending sound timing - When they use trending sounds, are they early adopters or late? Early adoption of trending audio can significantly boost algorithmic distribution.
Pillar 5: Hashtag Strategy
Hashtags remain relevant for Instagram Reels discovery in 2026, but their impact varies by how you use them. IShort's hashtag analytics feature lets you see exactly which hashtags a competitor uses and how they correlate with performance.
When analyzing competitor hashtags, track:
- Average hashtag count - How many hashtags do they typically use? Industry data shows 3-5 targeted hashtags often outperform 30 generic ones.
- Niche vs. broad hashtags - Do they use highly specific niche hashtags or broad popular ones? Niche hashtags often drive more qualified discovery.
- Hashtag-performance correlation - Which specific hashtags appear most frequently in their top-performing Reels? These are the tags worth testing in your own content.
- Hashtag evolution - Has their hashtag strategy changed over time? Successful creators often refine their hashtag lists based on performance data.
Pillar 6: Video Length Optimization
Video duration is one of the most actionable insights from competitive analysis. There is no universal "best" Reel length. It depends entirely on your niche, content type, and audience preferences. But you can find the answer by studying what works for competitors.
IShort records the duration of every Reel. Export competitor data and calculate:
- Average duration of top 10 Reels by views - This tells you the length your shared audience prefers for viral content.
- Average duration of top 10 Reels by engagement - This might differ from the views-based average, revealing a different optimal length for engagement.
- Duration distribution - Do they experiment with different lengths, or stick to a consistent range? Consistency in duration can signal a proven format.
Step-by-Step: Analyzing a Competitor with IShort
Here is the exact process to conduct a thorough competitive analysis using IShort. Follow these steps for each competitor you want to analyze.
- Install IShort (Free, 5 Seconds) Add the IShort Chrome extension from the Chrome Web Store. The extension is ready to use immediately.
- Navigate to the Competitor's Reels Tab Go to instagram.com/[username]/reels/ for the competitor you want to analyze. Make sure their profile is public. If it is private, you will need to follow them first.
- Scroll to Collect Data Scroll through their Reels grid. IShort automatically collects data for every Reel that loads. The extension icon badge shows the running count. For a thorough analysis, collect at least 50-100 Reels. For deeper insights, collect 200 or more.
- Open IShort and Sort by Views Click the IShort extension icon. You will see all collected Reels in a sortable table. Sort by views to see their most viral content at the top. Study the top 10-20 Reels for content theme patterns.
- Sort by Engagement Rate Switch the sort to engagement rate. This reveals content that resonated deeply with viewers, even if it did not go viral. Compare these Reels with the highest-view ones. Are they the same or different?
- Check the Posting Times Heatmap View the analytics dashboard to see when their best-performing Reels were posted. This heatmap reveals their posting schedule and when their audience is most active. These are likely the best posting times for your niche too.
- Export Data to CSV Export all collected data to a CSV file. Open it in Google Sheets or Excel for deeper analysis. Calculate averages, create charts, and compare across multiple competitors.
Building a Competitive Intelligence Dashboard
Once you have collected and exported data from 3-5 competitors, the next step is building a dashboard that lets you compare them side by side. This is where competitive analysis becomes truly powerful.
Setting Up Your Comparison Spreadsheet
Create a Google Sheets workbook with these tabs:
- Your Account - Your own Reels data exported from IShort
- Competitor 1-5 - One tab per competitor with their exported data
- Benchmarks - A summary tab comparing key metrics across all accounts
- Content Themes - A qualitative analysis of top-performing content categories
Key Metrics to Compare
| Metric | How to Calculate | What It Reveals |
|---|---|---|
| Average Views per Reel | Sum of all views / total Reels | Baseline reach and algorithmic favor |
| Median Views per Reel | Middle value of all view counts | Typical performance (less skewed by outliers) |
| Average Engagement Rate | (Likes + Comments) / Views across all Reels | Content quality and audience connection |
| Viral Hit Rate | Reels above 3x average views / total Reels | Ability to create breakout content |
| Posting Frequency | Total Reels / weeks in date range | Content output consistency |
| Avg. Video Duration | Sum of all durations / total Reels | Preferred content length in the niche |
| Original Audio Ratio | Original audio Reels / total Reels | Audio strategy and authenticity approach |
Visualizing the Data
Numbers in a spreadsheet are useful but charts make patterns jump out. Create these visualizations in your dashboard:
- Bar chart - Average engagement rate across all competitors and your account. This shows where you rank.
- Line chart - Views over time for each account. This shows growth trajectories and whether competitors are accelerating or plateauing.
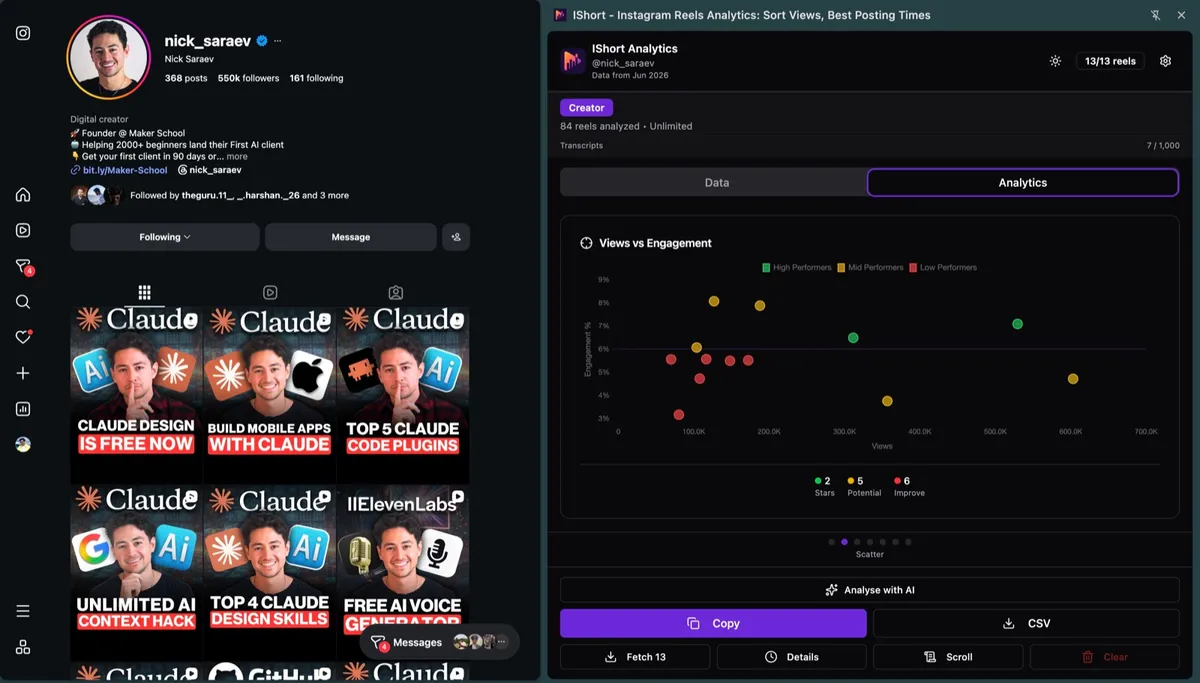
- Scatter plot - Views vs. engagement rate for each competitor's Reels. This reveals whether they optimize for reach or resonance.
- Pie chart - Content theme distribution for top-performing Reels across all competitors. This shows which topics dominate your niche.
Turning Insights into Action: Your 30-Day Plan
Data without action is just trivia. Here is a practical 30-day plan for applying your competitive analysis insights to your own content strategy.
Week 1: Audit and Benchmark
Complete your competitive analysis using the steps above. Build your comparison dashboard. Identify the top 3 performance gaps between you and your competitors. These gaps become your strategic priorities for the month.
Week 2: Content Theme Testing
Based on the content themes you identified in competitor top performers, create 4-5 Reels that cover similar topics with your unique angle. Do not copy their content. Extract the underlying theme and bring your own perspective, expertise, and personality to it.
For example, if a fitness competitor's top Reels are all "5-minute morning routines," your version might be "5-minute morning routine for people who hate mornings." Same theme, different angle, better hook.
Week 3: Format and Timing Optimization
Apply the posting time and video duration insights from your analysis. Post at the times when your competitors' best content was published. Match the video duration range that their top Reels cluster around. Test their audio strategy (original vs. trending) if it differs from yours.
Week 4: Measure and Iterate
Use IShort to analyze your own Reels from the past 3 weeks. Compare your metrics to the benchmarks you established. Did the content theme changes improve your views? Did the timing optimization boost engagement? What worked and what did not? Use these results to refine your strategy for the next month.
Start Your Competitive Analysis Today
Install IShort and analyze any competitor's Instagram Reels in minutes. See their views, engagement, posting times, hashtags, and content patterns. No API setup, no scraping, no cost.
Install IShort FreeCommon Mistakes in Competitive Analysis
Mistake 1: Copying Instead of Adapting
The goal is not to recreate your competitor's content. It is to understand why their content works and apply those principles to your unique voice and expertise. Copying makes you a follower. Adapting makes you a competitor.
Mistake 2: Analyzing Only One Competitor
A single competitor is a single data point. Their success might be due to factors specific to their account (existing audience, personal brand, paid promotion). Analyzing 3-5 competitors reveals what is universal to your niche versus what is specific to one account.
Mistake 3: Focusing Only on Top Performers
Studying only the biggest accounts in your niche is misleading. Their dynamics are different from yours. A creator with 1M followers has algorithmic advantages, brand partnerships, and audience loyalty that you cannot replicate at 10K followers. Include competitors at your current level and one tier above for realistic benchmarks.
Mistake 4: Doing It Once and Forgetting
Competitive analysis is not a one-time project. Niches evolve, algorithms change, and competitors adapt. Monthly analysis ensures you stay current with shifting trends and emerging strategies in your space.
Mistake 5: Ignoring Engagement in Favor of Views
Views are vanity metrics. A competitor with lower views but higher engagement rates is often doing better than one with viral reach but no audience connection. Always analyze both metrics to get the full picture.
Remember: The best competitive analysis leads to action, not just knowledge. Every insight you uncover should translate into a specific change in your content strategy. If an insight does not change what you do, it was not worth uncovering.
Best Instagram Competitor Analysis Tools in 2026 (Compared)
Several tools help you research competitor Reels, but they work very differently. Most require connecting your own account or paying before you can look at anyone else's content. Here is how the popular options compare for public-account competitor research.
| Tool | Competitor tracking | Free tier | Instagram login required? |
|---|---|---|---|
| IShort | Analyze any public account's Reels instantly, sort by views, engagement, posting times and hashtags | Yes, 500 reels/month free | No login, works as you browse |
| Metricool | Tracks a limited number of competitor profiles at a high level (followers, posting frequency) | Free plan with 1 competitor on some tiers | Requires connecting your account |
| Shortimize | Tracks a roster of short-form accounts you add across Reels, TikTok and Shorts | No free tier, trial only | Account-based, paid |
| Sked Social | Competitor tracking inside a broader scheduling/analytics suite | Trial, then paid | Requires connecting your account |
| Iconosquare | Competitor benchmarking in a full analytics suite | 14-day trial, then from $49/month | Requires connecting your account |
Key takeaway: most competitor analysis tools are built around your connected account and charge before you can study anyone else. IShort is the only free option that lets you open any public creator's Reels and instantly sort them by views, engagement, posting times and hashtags, with no Instagram login and no limit on which public accounts you can research.
Weighing the paid options against each other? See our detailed Shortimize vs Metricool pricing and features comparison for 2026.
Frequently Asked Questions
How do I analyze a competitor's Instagram Reels?
Analyze a competitor's Instagram Reels by installing the free IShort Chrome extension, opening their public /reels/ page, and scrolling once. IShort auto-collects views, likes, engagement, posting times, hashtags, and audio per Reel. Below: 6-pillar breakdown.
What should I look for when analyzing competitor Reels?
When analyzing competitor Reels, study 6 pillars: themes, posting frequency, engagement patterns, audio (original vs trending), hashtag usage, and video length. Each pillar maps to one algorithm signal. Below: how to score competitors on all six.
Can competitors see that I'm analyzing their Instagram Reels?
No — competitors cannot see that you're analyzing their Instagram Reels. IShort reads public page data in your browser without triggering profile views, story-style notifications, or any signal Instagram exposes. Same as scrolling their feed manually.
How many competitors should I analyze?
Analyze 3 to 5 competitors for the best results. Choose a mix of accounts at your level, one tier above you, and one aspirational account. This gives you realistic benchmarks and stretch goals. Analyzing too many competitors dilutes your focus and makes it harder to identify actionable patterns.
How often should I do competitive analysis on Instagram Reels?
Conduct a deep competitive analysis monthly and a quick check-in bi-weekly. Monthly analysis lets you track strategic shifts, identify emerging trends, and measure how your relative performance is changing. Bi-weekly check-ins help you catch trending formats or audio choices before they saturate the niche.
Is it legal to analyze competitor Instagram data?
Yes, completely legal. IShort only collects publicly available data that anyone can see by visiting an Instagram profile. It does not access private accounts, use unauthorized APIs, or violate Instagram's Terms of Service. Competitive analysis of public data is standard practice in every industry, from retail to media to technology.