Why Knowing Your Top Content Matters
Every Instagram creator has a handful of Reels that dramatically outperform the rest. These top performers are not accidents. They contain specific patterns in topic, format, timing, and presentation that triggered the algorithm to push them to a wider audience. The problem is that most creators never systematically identify these patterns because Instagram makes it nearly impossible to compare Reels side-by-side.
When you can identify your best performing Reels, you unlock a powerful feedback loop. You stop guessing what content to create and start making data-driven decisions. You invest your limited time and energy into formats that are proven to work for your specific audience, rather than experimenting blindly.
Consider the numbers. A typical Instagram creator posts 3-5 Reels per week. That is 150-250 Reels per year. Of those, maybe 10-15 will significantly outperform the average. Those 10-15 Reels often drive more than 50% of total views and follower growth. Finding them quickly and understanding why they worked is the single most impactful thing you can do for your Instagram strategy — and a top-performing Reel often won't be a top-performing video on every surface, since each platform ranks differently (see Instagram Reels vs TikTok vs YouTube Shorts for the surface-by-surface comparison).
The challenge is that Instagram only displays your Reels in reverse chronological order. There is no native way to sort by views, engagement, or any performance metric. You would need to click into each Reel individually, note down the stats, and compare them manually. For someone with 100+ Reels, that could take hours. This is exactly the problem that IShort solves by letting you sort Instagram Reels by views with a single click.
5 Ways to Identify Your Top Performing Reels
There is no single "best" metric for finding top performers. Each metric reveals a different dimension of performance. The most successful creators use multiple metrics together to build a complete picture. Here are the five most effective methods.
1. Sort by Total Views (Raw Reach)
The simplest and most intuitive method is sorting your Reels by total views. This tells you which content reached the most people — closely related to what does accounts reached mean on Instagram, which counts unique users rather than total impressions. High-view Reels indicate that Instagram's algorithm found your content engaging enough to distribute it widely through the Explore page, the Reels feed, and suggested content sections.
Views are the foundation metric because they represent the top of your content funnel. Without views, nothing else matters. A Reel cannot generate engagement, followers, or conversions if nobody sees it in the first place.
However, views alone can be misleading. A Reel might have high views because it was shared to a large audience but have a very low engagement rate. This could mean the content attracted eyeballs but did not resonate deeply enough to drive likes, comments, or shares. That is why you should combine views with other metrics.
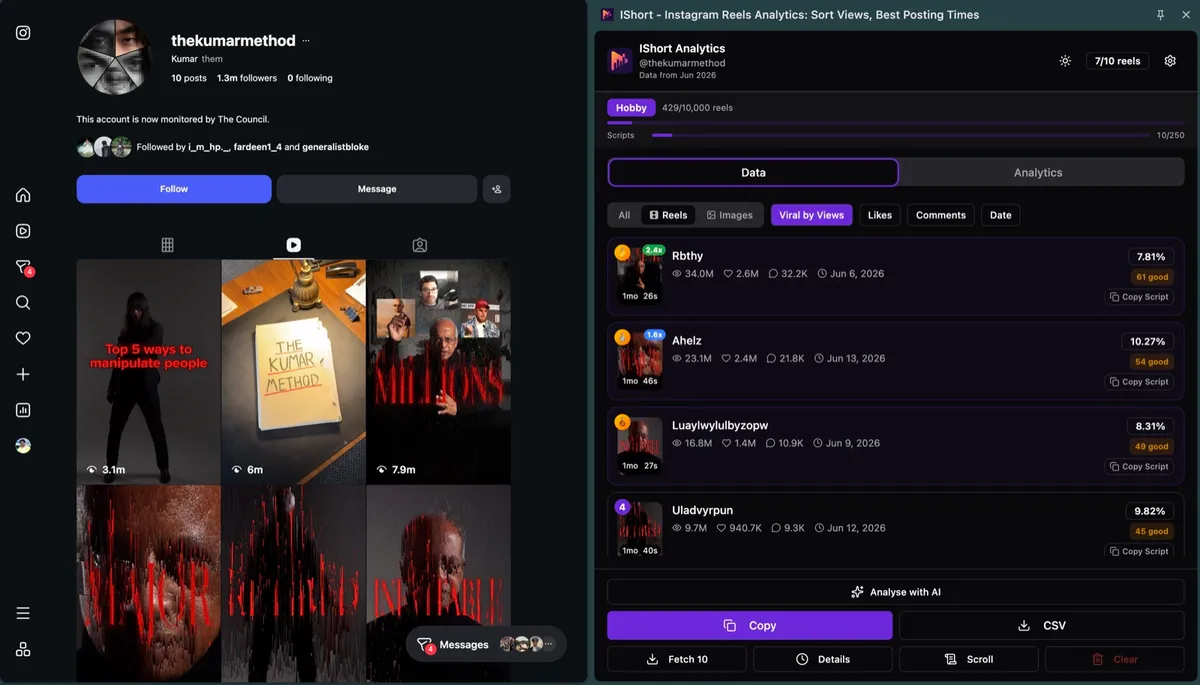
With IShort, sorting by views takes one click. Just open the extension after scrolling through your Reels tab, select "Views" from the sort dropdown, and your content is instantly ranked from highest to lowest views. The top 3 Reels receive gold, silver, and bronze medal badges so they stand out visually.
2. Sort by Engagement Rate (Audience Resonance)
Engagement rate measures how many viewers took action after watching your Reel. It is calculated as (likes + comments) divided by views, expressed as a percentage. A Reel with 10,000 views and 500 likes plus 50 comments has an engagement rate of 5.5%.
This metric is arguably more valuable than raw views because it tells you how deeply your content resonated. High engagement signals to Instagram that your content is worth promoting, which leads to even more distribution. It is a virtuous cycle: engaging content gets promoted, which brings more views, which brings more engagement.
When you sort by engagement rate, you often discover hidden gems. These are Reels that may not have gotten massive views but had exceptional audience response. Perhaps they received fewer views because they targeted a niche topic, but the viewers who did watch were highly engaged. These are often the most valuable Reels to study because they reveal what your core audience truly cares about.
Average engagement rates for Instagram Reels vary by niche and follower count, but a general benchmark is 3-5% for good engagement, 5-8% for great engagement, and anything above 8% is exceptional. Use IShort's performance score feature to see how each Reel stacks up.
3. Use the Outlier Score (Relative Performance)
The outlier score is one of IShort's most powerful features for finding top performers. It calculates your average views across all collected Reels, then shows how much each individual Reel deviates from that average. A 2x badge means the Reel got twice your average views. A 5x badge means five times your average. A 10x badge indicates a true viral hit.
Why is this better than just sorting by views? Because it accounts for growth over time. If you started with 1,000 followers and now have 50,000, your recent Reels naturally get more views than your older ones. Sorting by raw views would bias toward recent content. The outlier score, however, compares each Reel to the average at its relative position, making it easier to spot true standouts regardless of when they were posted.
Outlier Reels are particularly valuable to study because they represent moments when something you did connected with a much larger audience than usual. Was it the topic? The hook in the first three seconds? The time you posted? The hashtags you used? These are the questions that the outlier score helps you ask and answer.
| Outlier Score | What It Means | How Common |
|---|---|---|
| 1x - 1.5x | Average performance, close to your baseline | ~60% of Reels |
| 2x - 3x | Above average, performed notably well | ~25% of Reels |
| 3x - 5x | Strong outlier, significantly outperformed | ~10% of Reels |
| 5x - 10x | Viral hit, major algorithm push | ~4% of Reels |
| 10x+ | Mega viral, exceptional breakout content | ~1% of Reels |
4. Check the Viral Score (Holistic Virality)
Available on every IShort plan, the Viral Score is a composite metric rated from 0 to 100 that evaluates overall virality. Unlike single metrics like views or engagement rate, the Viral Score combines multiple signals into one easy-to-read number.
The Viral Score factors in four key components:
- Views relative to follower count: A Reel that gets 100K views on an account with 5K followers is far more viral than one that gets 100K views on an account with 500K followers.
- Engagement rate: How many viewers liked, commented, or shared the Reel.
- Growth velocity: How quickly the views accumulated. A Reel that hits 50K views in 24 hours is more viral than one that takes 30 days.
- Reach multiplier: The ratio of non-follower views to follower views, indicating how far beyond your existing audience the content spread.
A Viral Score above 80 indicates truly viral content. Scores between 60-80 represent strong performers. Anything below 40 is average or below average. When you sort your Reels by Viral Score, you get the clearest picture of which content achieved the most impressive distribution relative to your account size.
5. Evaluate Completion Rate (Content Quality)
Completion rate measures what percentage of viewers watched your Reel all the way through. While Instagram does not surface this metric directly in its public API, you can infer it from the relationship between views and engagement. High completion rate typically correlates with higher engagement because viewers who watch the entire Reel are more likely to like, comment, or share.
Why does completion rate matter? Because it is one of the strongest signals Instagram's algorithm uses to decide whether to promote content. If most viewers scroll past your Reel within the first two seconds, Instagram interprets this as low-quality content and stops distributing it. If viewers consistently watch to the end, Instagram pushes it to more and more people.
To identify Reels with high completion rates, look for content that has a high engagement rate relative to its duration. Short Reels (under 15 seconds) naturally have higher completion rates than longer ones. But a 60-second Reel with a 6% engagement rate likely has exceptional completion rate, meaning the content was compelling enough to hold attention for the full minute.
Key Takeaway: No single metric tells the full story. Your best performing Reels are the ones that score well across multiple dimensions: high views, strong engagement rate, outlier status, and solid completion. Use IShort to sort by each metric and look for Reels that appear in the top 10 across multiple sorts.
Using IShort's Sorting and Performance Score
IShort combines all five identification methods into a single, streamlined workflow. Here is how to use the extension to find your top performers quickly.
When you open IShort after scrolling through a profile's Reels, you see a sortable table with every Reel's key metrics displayed at a glance. Each Reel card shows the thumbnail, caption, views, likes, comments, duration, engagement rate badge, and outlier score badge. Premium users also see the Viral Score.
The Performance Score feature takes this a step further by assigning each Reel a comprehensive score based on all available metrics. This score is displayed on a 0-100 scale with color coding: green for top performers, yellow for average, and red for underperformers. Click any Reel to open a detailed insights modal that shows its rank, percentile, and actionable recommendations.
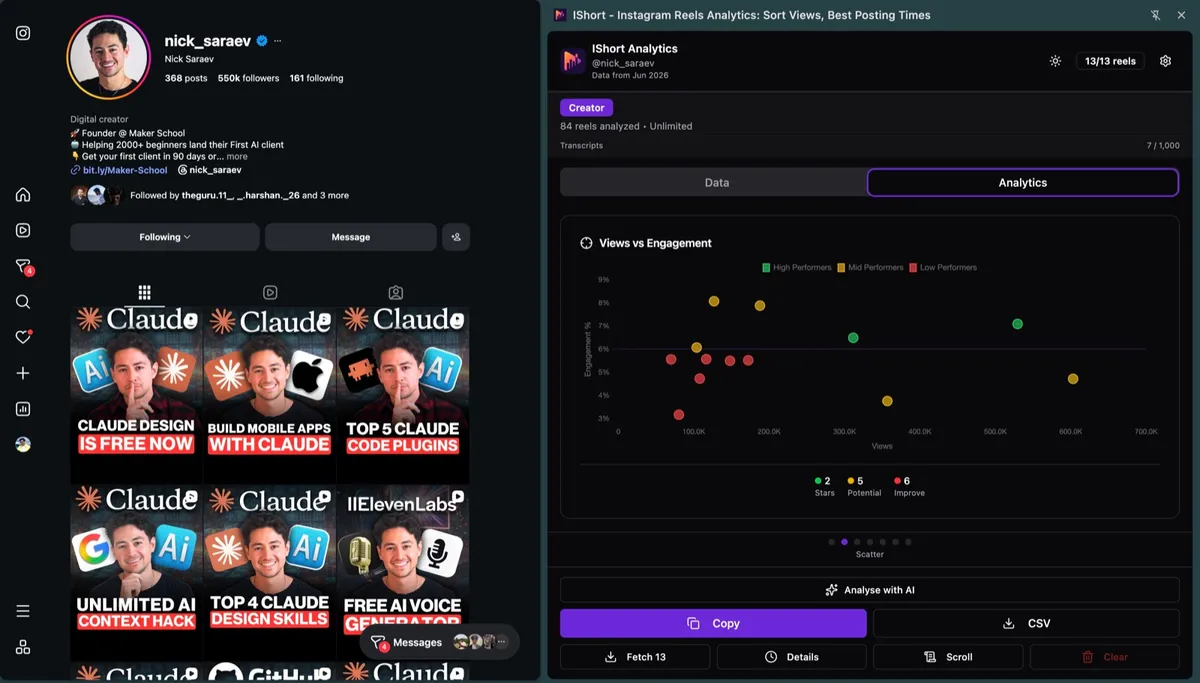
For a bird's eye view of your content performance, switch to the Analytics Dashboard. This view aggregates your data into visual charts showing performance trends over time, best posting hours, engagement by content type, and more. The dashboard makes it easy to spot macro-level patterns that individual Reel analysis might miss.
Quick Sort
Use the sort dropdown to instantly rank all Reels by views, likes, comments, engagement rate, date, or duration. Switch between ascending and descending with one click.
Visual Indicators
Top 3 Reels get medal badges. Outlier badges (2x, 3x, 5x, 10x) highlight content that significantly outperformed your average. Color-coded engagement badges show performance at a glance.
Detailed Insights
Click any Reel to see its performance score, rank among all your Reels, percentile position, and AI-generated tips for replicating its success (Premium).
Export for Analysis
Export your sorted data to CSV or copy to clipboard for deeper analysis in Google Sheets or Excel. Includes all metrics: views, likes, comments, hashtags, audio type, and more.
Analyzing Patterns in Your Top Content
Once you have identified your top 10-15 Reels, the real work begins: pattern analysis. You are looking for commonalities among your best performers that you can intentionally replicate. Here are the specific patterns to examine.
Content Format Patterns
Look at the visual format of your top Reels. Are they talking head videos where you speak directly to camera? Screen recordings with voiceover? Text overlay videos with trending audio? B-roll compilations? Most creators find that one or two formats consistently outperform the others. Once you identify your winning format, lean into it.
Topic and Theme Patterns
What subjects did your top Reels cover? Group them by theme. You might find that "how-to" tutorials outperform opinion pieces, or that personal stories beat educational content. This tells you what your audience values most. Double down on the topics that resonate.
Hook and Opening Patterns
The first 1-3 seconds of your Reel determine whether viewers watch or scroll. Study the openings of your top performers. Did they start with a provocative question? A bold claim? A surprising visual? An on-screen text hook? The patterns here are often very specific to your niche and audience. What hooks your audience may be very different from what hooks a general audience.
Duration Patterns
Sort your top Reels by duration alongside views. You will likely see a clear sweet spot. For many creators, Reels between 7-15 seconds perform best. For educational creators, the sweet spot might be 30-45 seconds. IShort's analytics dashboard shows average views by duration range, making this analysis straightforward.
Timing Patterns
When were your top Reels posted? IShort tracks the day of week and time of day for each Reel. You might discover that your best content was posted on Tuesday mornings or Sunday evenings. While posting time is not the only factor in success, it can give your content an initial boost that triggers algorithmic distribution.
Audio Patterns
Did your top Reels use original audio or trending sounds? IShort categorizes each Reel by audio type (original vs. licensed music) and tracks the specific audio used. If your best Reels all used trending sounds, that is a clear signal to incorporate more trending audio into your strategy. If original audio won, it means your voice and commentary are the draw — for a side-by-side breakdown of the trade-offs, see original audio vs trending sounds on Instagram.
How to Replicate Your Success
Pattern analysis is only valuable if you act on it. Here is a systematic approach to turning your top performer insights into a repeatable content strategy.
- Create a "Top Performer Profile" After analyzing your top 10 Reels, write down the common attributes: format, topic type, duration range, audio type, posting time, and hook style. This becomes your content blueprint.
- Plan Content That Matches the Profile For your next batch of Reels, intentionally create content that matches at least 3-4 attributes of your top performer profile. If your best Reels are 10-second text overlays about productivity tips posted on weekday mornings, create more of exactly that.
- Test One Variable at a Time While following your blueprint, experiment with one variable at a time. Change the hook style while keeping everything else the same. Or try a different posting time. This lets you isolate which factors truly drive performance versus which are coincidental.
- Track Results Weekly Use IShort to check your new Reels' performance after 7 days. Compare their views, engagement, and outlier scores to your historical averages. Are your blueprint-based Reels outperforming random content? The data will tell you.
- Refine and Iterate Every month, re-sort your Reels and update your top performer profile. As your audience grows and evolves, so will the content that resonates. The creators who grow fastest are the ones who continuously refine their strategy based on data.
This approach transforms content creation from a guessing game into a data-driven process. You are no longer hoping a Reel goes viral. You are systematically creating content that matches the proven formula for your specific audience, and you are using IShort's data to continuously improve that formula.
Find Your Top Reels in Seconds
Stop guessing which content works. Install IShort and instantly sort your Reels by views, engagement, outlier score, and more. Identify your top performers and replicate your success.
Install IShort FreeStep-by-Step Guide: Finding Top Reels with IShort
Here is the complete walkthrough for finding your best performing Reels from start to finish.
- Install IShort from the Chrome Web Store Visit the Chrome Web Store listing and click "Add to Chrome." The extension is free and installs in under 10 seconds.
- Go to Your Instagram Reels Tab Open Instagram in Chrome and navigate to your profile. Click the Reels tab (the clapperboard icon) to see your Reels grid. You can also analyze any public profile's Reels.
- Scroll to Load All Your Reels Scroll down the page to load as many Reels as possible. IShort automatically collects data as new Reels appear. For a thorough analysis, scroll until all your Reels are loaded. The more data points you have, the more accurate your pattern analysis will be.
- Open the IShort Extension Click the IShort icon in your Chrome toolbar. The extension popup opens showing all collected Reels in a sortable table with key metrics displayed for each.
- Sort by Views to Find Your Most Viral Content Select "Views" from the sort dropdown. Your Reels are instantly ranked from most-viewed to least-viewed. The top 3 receive medal badges. Note which Reels appear at the top and look for common patterns.
- Sort by Engagement to Find Audience Favorites Switch the sort to engagement rate. Some of your top-engagement Reels will be different from your top-view Reels. These are the hidden gems that resonated deeply with viewers but may not have gotten wide distribution. They reveal what your core audience truly values.
- Check Outlier Scores for Breakout Content Look for Reels with 3x, 5x, or 10x outlier badges. These are the Reels that dramatically outperformed your average. Study them closely. What made them break out? Was it the topic, the hook, the timing, or the format?
- Export Data for Deeper Analysis Click the export button to download your Reel data as CSV. Open it in Google Sheets or Excel to create charts, calculate correlations, and perform deeper analysis. Sort by multiple columns to find Reels that rank well across several metrics simultaneously.
Learning from Competitors' Top Content
One of IShort's most powerful applications is competitive analysis. Since the extension works on any public Instagram profile, you can use the same methods described above to find your competitors' top performing Reels. This is invaluable for understanding what works in your niche beyond your own content.
Navigate to a competitor's Reels tab, scroll to load their content, and sort by views. Their top Reels reveal the topics, formats, and styles that resonate with an audience similar to yours. Look for content gaps: topics they have not covered that you could own. Look for format ideas you have not tried. Look for engagement patterns that differ from yours and consider why.
IShort's analytics dashboard lets you compare data across different profiles, giving you a side-by-side view of how your content performs relative to competitors. Combined with insights from the viral content guide, this competitive intelligence helps you build a strategy that is both data-driven and competitively informed.
Pro Tip: Analyze at least 3-5 competitors in your niche. Look for patterns that appear across multiple accounts, not just one. If all top-performing fitness Reels in your niche are under 20 seconds with text overlays, that is a strong niche-wide signal, not just one creator's preference.
Common Mistakes When Evaluating Top Content
As you begin analyzing your top performers, watch out for these common pitfalls that lead to incorrect conclusions.
- Recency bias: Your most recent Reels may appear to perform better simply because they were posted to a larger audience. Use the outlier score instead of raw views to account for audience growth over time.
- Sample size too small: Drawing conclusions from 5 Reels is unreliable. Aim for at least 30-50 Reels before identifying patterns. One viral Reel does not make a trend.
- Ignoring context: A Reel might have gone viral because of external factors like a celebrity share or trending topic, not because of the content itself. Consider whether the success is replicable.
- Focusing on only one metric: A Reel with high views but low engagement tells a different story than one with moderate views but high engagement. Use multiple metrics to build a complete picture.
- Not acting on insights: Analysis without action is wasted time. Once you identify patterns, commit to creating content that matches them for at least 4-6 weeks before evaluating results.
Frequently Asked Questions
How do I find my best performing Instagram Reels?
Find your best performing Instagram Reels by installing the free IShort Chrome extension, opening your /reels/ tab, scrolling to load all, then sorting by views, engagement rate, or outlier score. Top performers appear instantly. Below: which metric to trust.
What metrics should I use to identify top performing Reels?
To identify top performing Reels, combine 4 metrics: views (reach), engagement rate (resonance), outlier score (over your average), and completion rate (quality). Reels that rank well across all 4 are true winners. Below: how to weight each one.
Can I find top performing Reels on a competitor's profile?
Yes, you can find top performing Reels on a competitor's profile — IShort works on any public Instagram account. Open their /reels/ tab, scroll, then sort by views or engagement. Export to CSV for deeper benchmarking. Below: 6-pillar competitive read.
What is the difference between outlier score and viral score?
Outlier score measures how much a Reel outperforms your own average views. A 3x outlier means the Reel got three times more views than your typical Reel. It is relative to your personal baseline. Viral Score is a 0-100 composite metric that factors in views relative to followers, engagement rate, growth velocity, and reach multiplier. It provides a holistic measure of virality that accounts for account size. Both the outlier score and Viral Score are available on every plan, including Free.
How many Reels should I analyze to find meaningful patterns?
For reliable pattern analysis, aim to analyze at least 30-50 Reels. This gives you enough data to identify genuine trends versus coincidences. If you have fewer than 30 Reels, analyze all of them but be cautious about drawing strong conclusions. The more data points you have, the more confident you can be in the patterns you identify. IShort collects data as you scroll, so there is no limit to how many Reels you can include.
Does Instagram show which Reels perform best?
Instagram Insights shows individual Reel metrics like views, likes, comments, shares, saves, and reach. However, it does not let you sort or rank your Reels by any performance metric. You have to check each Reel one at a time, which is tedious and makes comparison difficult. IShort solves this by collecting all your Reel data and letting you sort by any metric with one click, giving you an instant performance ranking.
Start Finding Your Top Reels Today
Join thousands of creators who use IShort to identify their best content and grow faster. Install in seconds. Free forever. No credit card required.
Get IShort Free